A child who has been abandoned or removed from the care of both birth parents can gain much from being adopted into a loving family. Adoptive families typically provide the children in their care with residence in a safe, supportive neighborhood, attendance at a well-functioning, high-achieving school, and love, emotional support, and intellectual stimulation at home.1 These environmental benefits should enable the young person to rise above the loss of their birth parents and any adverse experiences and enable them to flourish—or so current models of children’s development would lead us to believe.
Yet adopted children and their parents often encounter unexpected difficulties, especially when the child gets to school.2 Our analysis of newly-released data from the U.S. Department of Education shows just how prevalent learning and behavioral issues are among adopted students in elementary, middle, and high school. The data derive from a 2016 survey of the parents and guardians of a nationally-representative sample of 14,075 students in public, private, charter, and home schools across the country.3 The sample included 436 adopted students.4
Adopted Students Are More Likely to Have Trouble in School
Adoptive parents reported that an 83% majority of their children enjoyed going to school and nearly half—49%—were doing “excellent” or “above average” school work.5 But when compared to students living with their married biological parents, there were substantially more adopted students who performed poorly on indicators of academic progress and school adjustment. As the figure below shows, adopted students were:
- twice as likely to have had their parents contacted in the last year due to schoolwork problems;
- three times as likely to have had their parents contacted in the last year due to classroom behavior problems;
- four times more likely to have repeated a grade;
- and three times more likely to have been suspended or expelled from school.
On the other hand, adopted students were no more likely than other students to be absent often from school (for 11 or more days during the school year).
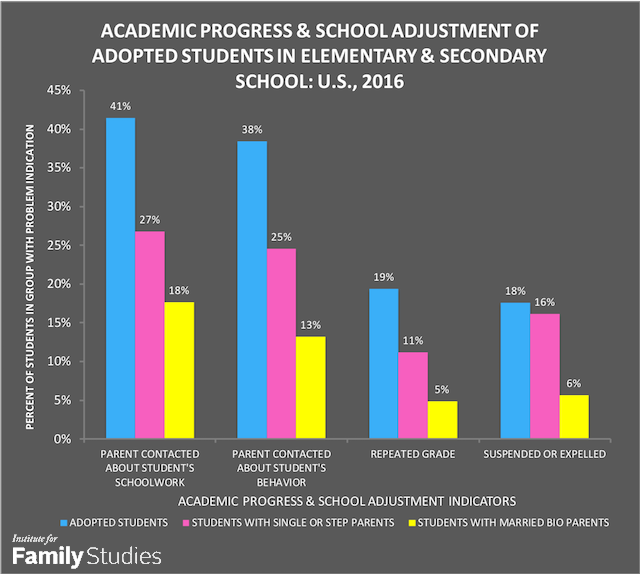
When we used regression analysis to adjust the academic performance indicators for disparities across groups in related factors like parent education, family income, and age, sex, and race of the students, we found that adopted students continued to have significantly higher problem rates. Indeed, because adoptive families tend to be well above average in income and educational attainment,6 the statistical adjustments sometimes magnified the differences in problem frequencies. After adjustment, the odds on adopted students repeating a grade or having a parent contacted for behavioral issues were 4 times higher than those for students living with married birth parents. The odds of having parents contacted for schoolwork problems were three times higher, and the odds of being suspended or expelled were 2.85 times higher.
Adopted students had greater odds than students from single-parent or step-families of having parents contacted for schoolwork or behavior problems, and of repeating a grade. Their odds of being suspended were not significantly different from those of students with single or step parents.
The Majority of Adopted Students Have Health Problems
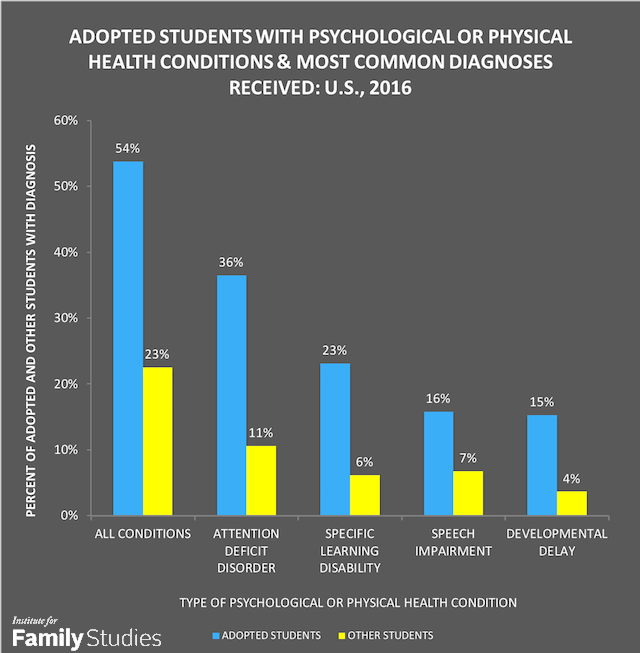
A 54% majority of adoptive parents reported that a health or education professional had told them that their child had a condition that affected their ability to learn, get along with other children, or engage in physical activities. The comparable figure for students who were not adopted was 23%, and for students living with both married parents, 18%. As shown in the following figure, the most common conditions with which adopted children were diagnosed were attention deficit disorder (36%), specific learning disability (23%), speech impairment (16%), and developmental delay (15%). All of these proportions were significantly higher than those for non-adopted students, which are shown in the figure below.
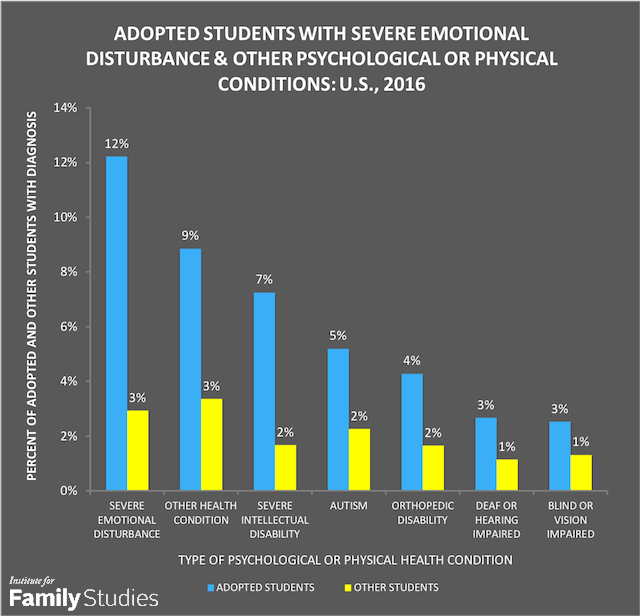
In addition, as shown in the figure below, 12% of adopted students had been diagnosed with a severe emotional disturbance, and 7% with a severe intellectual disability. The comparable proportions for all non-adopted students were 3% and 2%, respectively. In comparison, the proportion of students living with both married birth parents who had a severe emotional disturbance was only one percent.
Five percent of adopted students were said to have autism and 4% to have orthopedic impairments. These proportions were double those among non-adopted students. Three percent of adopted children were deaf or hearing-impaired, and the same proportion were blind or vision-impaired. However, these proportions were not significantly different than those for students who were not adopted.
After adjusting for demographic and socioeconomic factors, the odds of a student being diagnosed with one of the psychological or physical conditions mentioned above were five times higher for adopted students than for students living with both married parents. They were also significantly higher than for students in single- or step-parent families, as well as those living with cohabiting biological parents.7
The odds of a student having a severe emotional disturbance were more than 10 times higher for adopted students than for those living with both married parents. The odds of such a disturbance were comparable to those for students living with foster parents or grandparents and significantly greater than for those living with single- or step-parents.8
Is it primarily adopted students with a diagnosed psychological or physical condition who have learning or behavior problems at school? To answer that question, the figure below compares adopted students with and without a diagnosed condition on the same achievement and adjustment indicators presented in Figure 1. Adopted students with a diagnosed condition were significantly more likely to have repeated a grade (28% versus 9%) and to have had their parents contacted about their schoolwork (53% versus 29%). They were also less likely to be described as doing excellent or above average schoolwork (29% versus 71%). As shown in Figure 3 below, they appeared to have higher rates of suspension and parent contact for classroom behavior problems. The latter differences were not statistically significant, however. Nor was an apparent difference in the proportion of students who did not enjoy going to school.
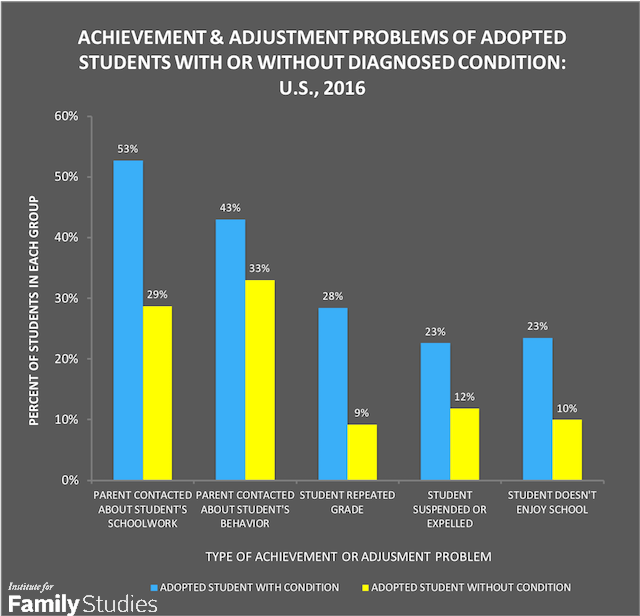
Both adopted students with a diagnosed condition and those without such a condition had significantly higher rates of school suspension than students living with married birth parents (23% and 12% versus 6%). They also had higher rates of having parents contacted for behavior problems (43% and 33% versus 13%). After adjusting for demographic and socioeconomic factors, the odds of being suspended were more than 3 times higher for adopted students with a condition and 2 times higher for adopted students without a condition. The odds of having parents contacted for problem behavior were nearly 5 times higher for adopted students with a condition and 3 times higher for those without a condition.
So, while adopted students with a diagnosed psychological or physical condition clearly have more frequent learning problems, it is not only those adopted students who have behavioral issues at school.
Why Do Adopted Students Have More Problems in School?
Based on the circumstances surrounding their births, it is perhaps not surprising that adopted children tend to struggle in school. Infants and older preschool-aged children who become available for adoption are usually the results of surprise pregnancies. Their birth parents may have given them up voluntarily, feeling unwilling or unable to care for the child themselves. In some cases, they may have had the child removed from their care by a court or child welfare agency after allegations of alcoholism, substance abuse, mental illness, neglect or child abuse on the part of one or both parents. Thus, the circumstances surrounding the birth and early care of most adopted children can be problematic, to say the least. At worst, their family conditions were highly stressful or downright toxic.
Based on the qualities of the adoptive homes in which they currently reside, however, one might expect that adopted children, especially those adopted in infancy, would do well in school. In general, adoptive families tend to be better off financially than other families with children. This is partly due to self-selection and partly to the screening that adoptive parents must go through before they are allowed to adopt. In addition, adoptive parents have higher levels of education and put more effort into caring for their children than biological parents do.9
As the survey results show, many adopted children do perform well in school, learning up to their potentials and getting along well with other pupils. Even among those who have difficulties, a majority enjoy going to school and receive counseling and special education services to help them and their parents cope with their health conditions.
There is little question that adopted children are better off than they would be in long-term foster or institutional care. At the same time, the survey data reveal the complex challenges adopted children face in overcoming the effects of early stress, deprivation, and the loss of the biological family. It is vital that current and potential adoptive parents be aware of the challenges they may face, as well as the eventual benefits that will accrue to them and the child as a result of the love and resources they provide and the struggles they endure.10
Nicholas Zill is a research psychologist and a senior fellow of the Institute for Family Studies. He directed the National Survey of Children, a longitudinal study that produced widely cited findings on children’s life experiences and adjustment following parental divorce. W. Bradford Wilcox is a senior fellow of the Institute for Family Studies and the director of the National Marriage Project at the University of Virginia.
1. Vandivere, S., Malm, K., & Radel, L. (2009). Adoption USA: A chartbook based on the 2007 national survey of adoptive parents. Washington, D.C.: The U.S. Department of Health and Human Services, Office of the Assistant Secretary for Planning and Evaluation. Hamilton, L., Cheng, S., & Powell, B. (2007). Adoptive parents, adaptive parents: Evaluating the importance of biological ties for parental involvement. American Sociological Review, 72, 95–116. Zill, N., & Bramlett, M.D. (2014). Health and well-being of children adopted from foster care. Children and Youth Services Review. Vol. 40, 29–40. Case, A., & Paxson, C. (2001). Mothers and others: Who invests in children’s health? Journal of Health Economics, 20, 301–328.
2. Zill, N. (2015) The paradox of adoption. Research brief. Charlottesville, VA: Institute for Family Studies. https://ifstudies.org/blog/the-paradox-of-adoption. Zill, N. (2015, December). How adopted children fare in middle school. Research Brief. Charlottesville, VA: Institute for Family Studies. https://ifstudies.org/blog/how-adopted-children-fare-in-middle-school . See also: Brand, A.E., & Brinich, P.M. (1999). Behavior problems and mental health contacts in adopted, foster, and nonadopted children. J. Child Psychol. Psychiat. Vol. 40, No. 8, pp. 1221—1229. Gunnar, M.R., Van Dulmen, M.H.M., & The International Adoption Project Team. (2007). Behavior problems in post-institutionalized internationally adopted children. Development and Psychopathology. Vol. 19, 129–148. van IJzendoorn, M.H., Juffer, F. and Klein Poelhuis, C.W. (2005). Adoption and cognitive development: A meta-analytic comparison of adopted and nonadopted children’s IQ and school performance. Psychological Bulletin, Vol. 131, No. 2, 301–316.
3. The study was the 2016 National Household Education Survey, Parent and Family Involvement Component. See https://www.nces.ed.gov/nhes
4. 25% of the adopted students were in the 5-9 year age range, 24% in the 10-12 year range, 25% in the 13-15 years old, and 26%, 16-19 years old at the time of the survey. The average age of the adopted students was 12½, slightly but significantly older than students living with both married parents (11¾), but not significantly different than other non-adopted students. 53% of the adopted students were male and 47% female, which was not significantly different from the non-adopted students (52% male). 17% of the adopted students were foreign-born, significantly higher than the 5% of non-adopted students. 44% of the adopted students were white, 21% Hispanic; 19%, black; 6% Asian or Pacific Islander; 8%, multiracial; 2%, American Indian or Alaskan Native. Compared to non-adopted students, white students were underrepresented among the adopted, while black, multiracial, and American Indian were overrepresented. All of these percentages are weighted to be representative of the U.S. national student population.
5. Although the proportions of adopted students who enjoyed school and were doing above average schoolwork are encouraging, these proportions were significantly smaller than those for students living with married birth parents: 92% of the latter group enjoyed going to school, and 72% were doing excellent or above average schoolwork.
6. For example, 58% of the adopted students in the 2016 NHES had adoptive parents who were college graduates or more. Only 7% had less than a high school education.
7. The odds ratio for having a psychological or physical condition was 1.54 for students with birth mothers only; 1.49 for those with a birth parent and stepparent; and 1.44 for those with cohabiting birth parents, all in comparison to students living with married birth parents, and all significantly less than the 5.39 odds ratio for adopted students.
8. The odds ratio for severe emotional disturbance was 8.68 for students with foster parents and 7.88 for those with grandparents, not significantly different from the 10.80 odds ratio for adopted students. The odds ratio was 3.24 for students with birth mothers only, and 3.51 for those with a birth parent and stepparent, significantly less than the odds for adopted students. All these odds are in comparison to those for students living with married birth parents.
9. See Hamilton, Cheng, & Powell (2007), cited above. And Zill & Bramlett (2014), cited above.
10. Sacerdote, B. (2000). The nature and nurture of economic outcomes. NBER Working Paper No. 7949. Cambridge, MA: National Bureau of Economic Research.


